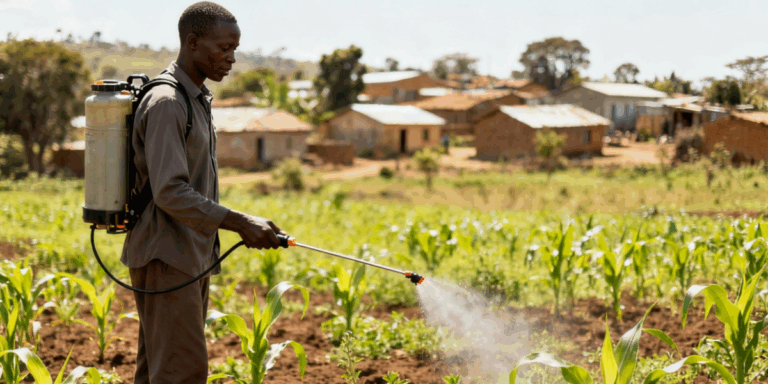
Greenhouse gases (GHGs) play a critical dual role in agriculture: the industry is both a significant source of these emissions and is heavily impacted by the effects of climate change, primarily through shifting weather patterns. Agriculture contributes to greenhouse gas emissions through multiple sources, methane released by livestock and rice paddies, nitrous oxide emitted from fertilized soils and decomposing crop residues, and carbon dioxide generated by the use of machinery and land-use changes. GHG emissions in turn affect the sustainability and productivity of agricultural systems, which directly affects food security for a growing global population. This post aims to contextualise South African agriculture’s GHG footprint by comparing it globally and locally.
GHGs are gasses in the earth’s atmosphere that trap heat, which contributes to the greenhouse effect, global warming and climate change. The main GHGs consist of carbon dioxide, methane (fossil and non-fossil), nitrous oxide, nitrogen trifluoride and sulphur hexafluoride. GHG emission is a common measurement for environmental impact and is often referenced, as for example in the international Paris Agreement. However, the GHG measurement does have its limitations, as it does not account for other environmental issues, like air and water pollution, biodiversity loss, land degradation and resource depletion. Nevertheless, it is a popular proxy since it is quantifiable across sectors, regions and time. To conduct comparisons, the different GHGs are converted into carbon dioxide equivalent (CO₂ eq.) by multiplying its weight by each GHG’s global warming potential (the amount of heat a GHG traps in the atmosphere over a specific time period, compared to CO₂). Table 1 lists the most recent Intergovernmental Panel on Climate Change (IPCC) global warming potential values. As the table illustrates, the values have changed between the most recent assessment reports. Furthermore, global warming potential values per GHG can vary depending on the source and the time horizon used (20 years, compared to 100 years or 500 years), creating uncertainty around the accuracy of GHG measurement and reporting.
Table 1: IPCC Global Warming Potential values relative to CO₂
| GHG | Global warming potential value over 100 years | ||
| 4th Assessment Report | 5th Assessment Report | 6th Assessment Report | |
| Carbon dioxide | 1 | 1 | 1 |
| Methane (fossil) | 25 | 28 | 27 |
| Methane (non-fossil) | N/A | 30 | 29.8 |
| Nitrous oxide | 298 | 265 | 273 |
| Nitrogen trifluoride | 17 200 | 16 100 | 17400 |
| Sulphur hexafluoride | 22 800 | 23 500 | 24 300 |
Source: IPCC, 2024
According to EDGAR data[1], South Africa was the 16th largest GHG emitter in the world in terms of total GHG emissions over the past decade (2014 to 2023). But with a slight reduction in emissions in recent years, and emission increases of other countries, South African is now the 18th largest emitter (2021 to 2023). Agriculture is the fifth largest GHG-emitting sector in South Africa, following the power industry, fuel exploitation, transport and industrial combustion, and leading industrial processes, waste, and buildings[2]. In South Africa, agriculture contributed roughly 7.1% of total GHG emissions (average from 2014-2023), compared to the global average for the sector of 12.5% (EDGAR, 2024).
Figure 1 compares South Africa’s agricultural GHG emissions to those of the top 20 total[3] GHG-emitting countries (sorted by agricultural GHG per GDP emissions). South Africa’s agricultural GHG emissions per GDP are slightly above the global total, above the EU 27 countries, but below Pakistan, Brazil, Australia, India and Indonesia. When considering agricultural GHG emissions per capita (right axis in Figure 1), South Africa is below the global average and only above India and China (which have a large population), Indonesia, Iran, South Korea, Japan and Saudi Arabia.
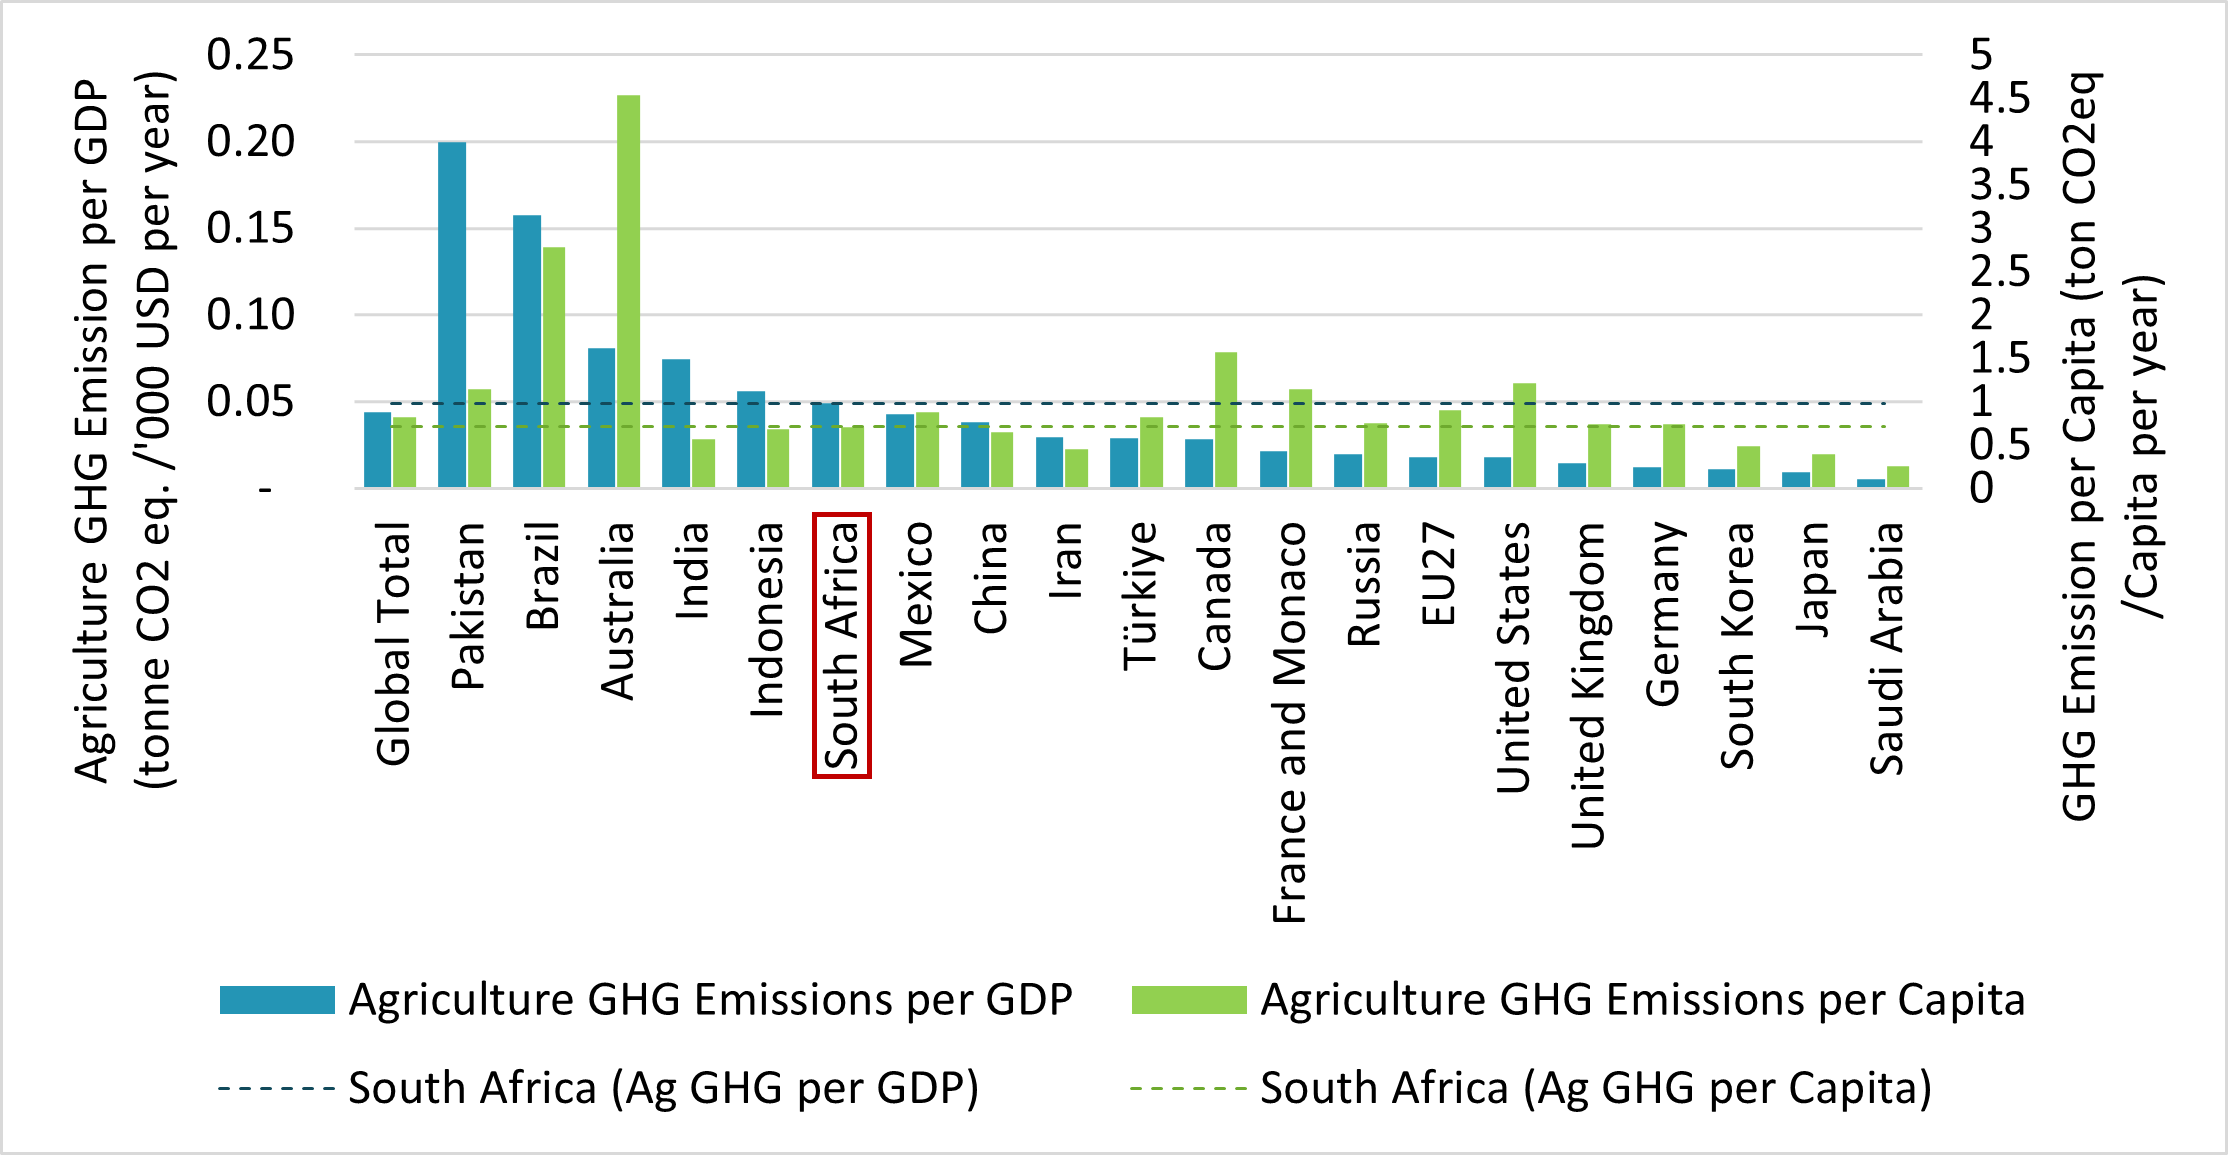
Figure 1: Agricultural GHG Emissions per GDP and per Capita (10-year average 2014-2023)
Source: EDGAR, 2024
Note: GHG emissions include CO₂ (fossil only, energy-use is allocated to the Energy sector), CH4, N₂O and F-gases. Data is aggregated using Global Warming Potential values from IPCC AR5 (GWP-100 AR5).
Figure 2 illustrates that South Africa’s primary agricultural GHG emissions mainly consist of methane and nitrous oxide (when excluding energy emissions from the agricultural sector). According to the EDGAR data, the largest agricultural GHG contributor in South Africa is enteric fermentation (mainly from ruminant digestion producing methane) and livestock manure (decomposing and releasing methane and nitrous oxide). Crop production also contributes to the emission of nitrous oxide through fertilizer application, nitrogen leaching, and soil microbial activities. According to EDGAR data Figure 2, CO₂ emissions only contribute about 2.6% to total South African agricultural GHG emissions (aligned with the global average).
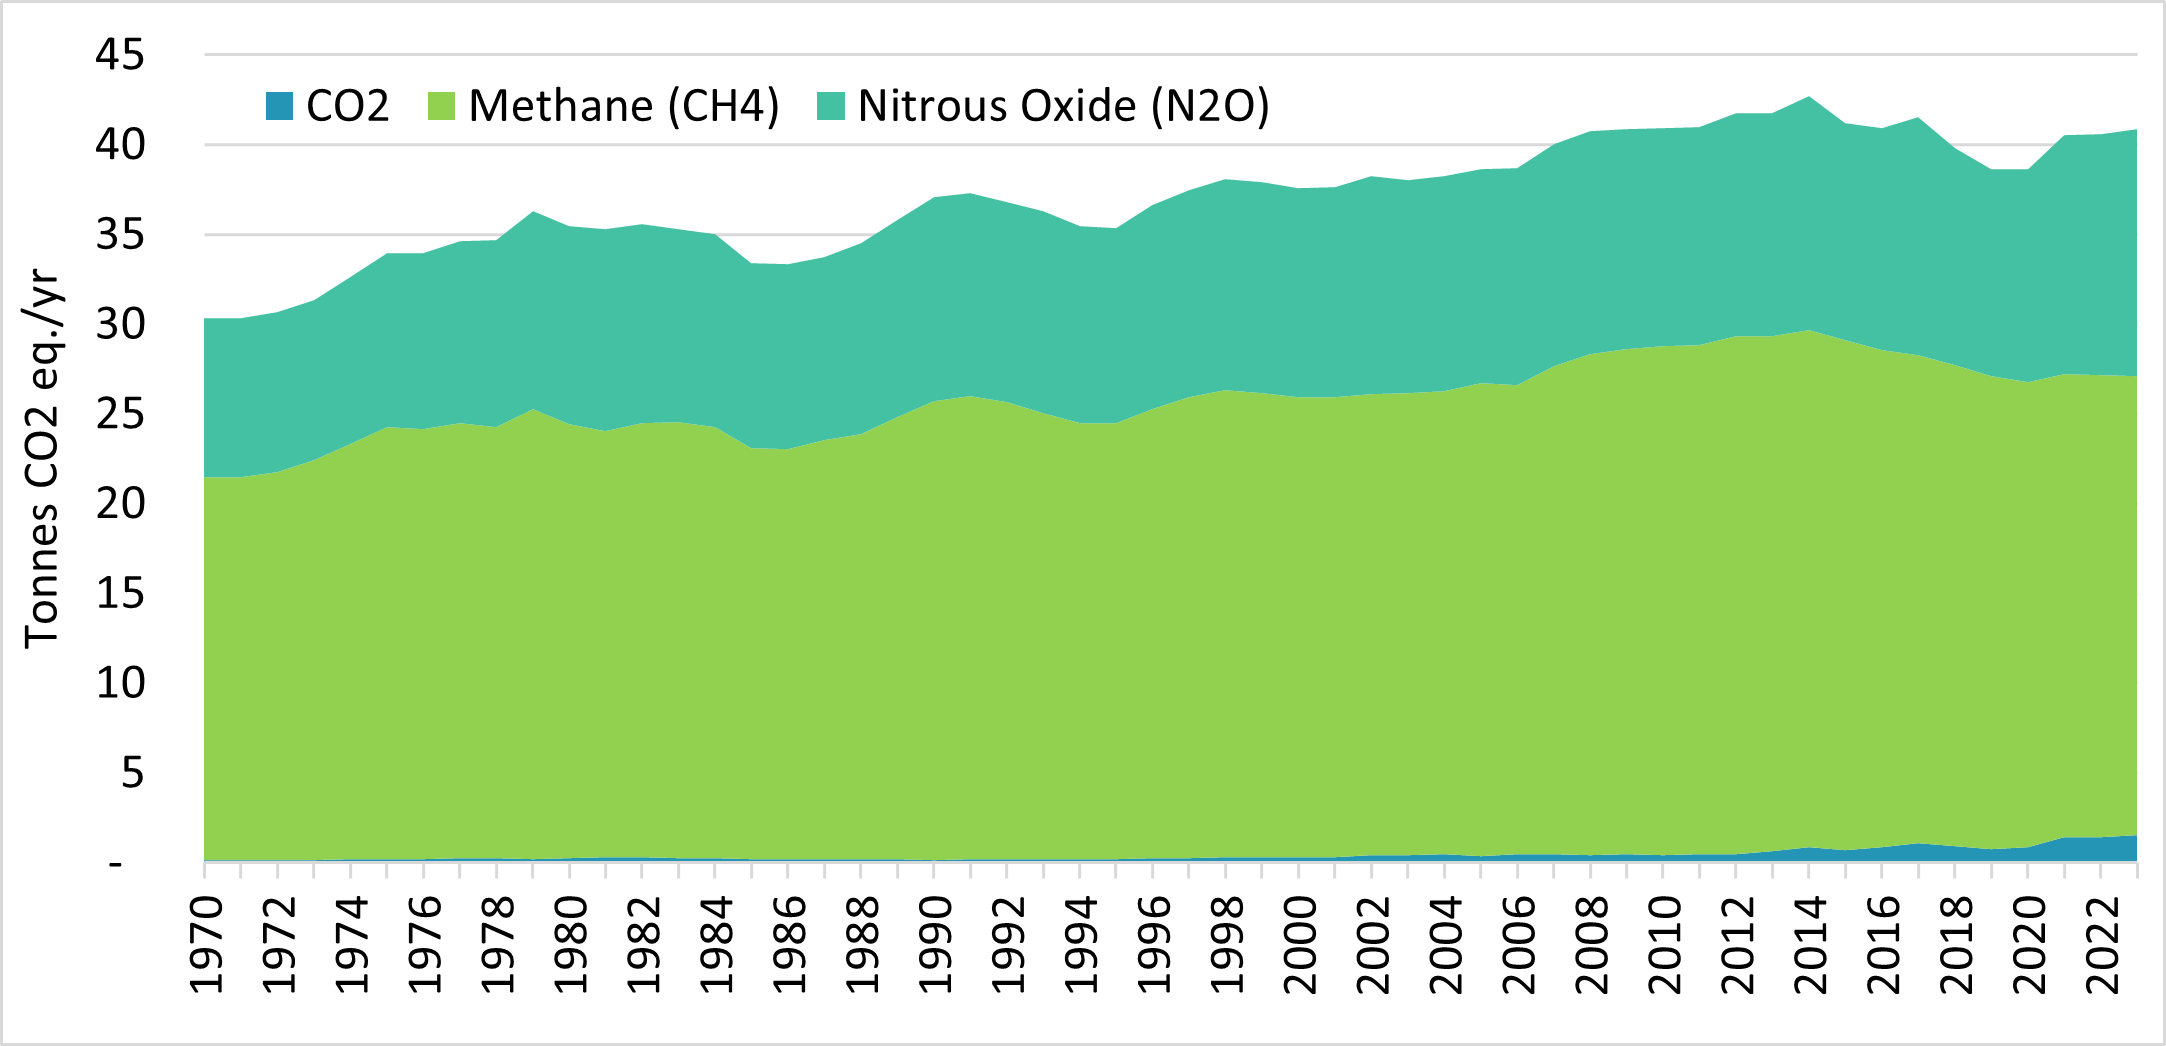
Figure 2: South Africa’s Agricultural GHG Emissions by Type
Source: EDGAR, 2024
Note: GHG emissions include CO₂ (fossil only, energy-use is allocated to the Energy sector), CH4, N₂O and F-gases. Data is aggregated using Global Warming Potential values from IPCC AR5 (GWP-100 AR5).
These EDGAR GHG emissions (Figure 1 and Figure 2) only include emissions form agricultural soils, crop residues burning, enteric fermentation, manure management, and indirect N₂O emissions from agriculture. However, the EDGAR data does not include emissions from land-use-change and energy usage (energy is allocated to the energy sector in the EDGAR data, and land-use-change is captured separately). The FAO data in Figure 3 includes emissions beyond the farm gate, land-use-change, and emission from energy (before-, on- and beyond-farm)[4].
Figure 3 illustrates the agricultural and food system emissions based on FAO data (2024). Although this may vary significantly at a sub-sector or commodity level, FAO data suggests that, on average, 51% of GHG emissions occur off-farm due to land-use change and pre- and post-production. The remaining 49% farm gate emissions are mainly due to enteric fermentation (17%), on-farm energy use (15%), livestock manure (10%) and burning of savannah fires and residue (3%). Synthetic fertiliser only accounts for 3% of GHG emissions of the agricultural industry.
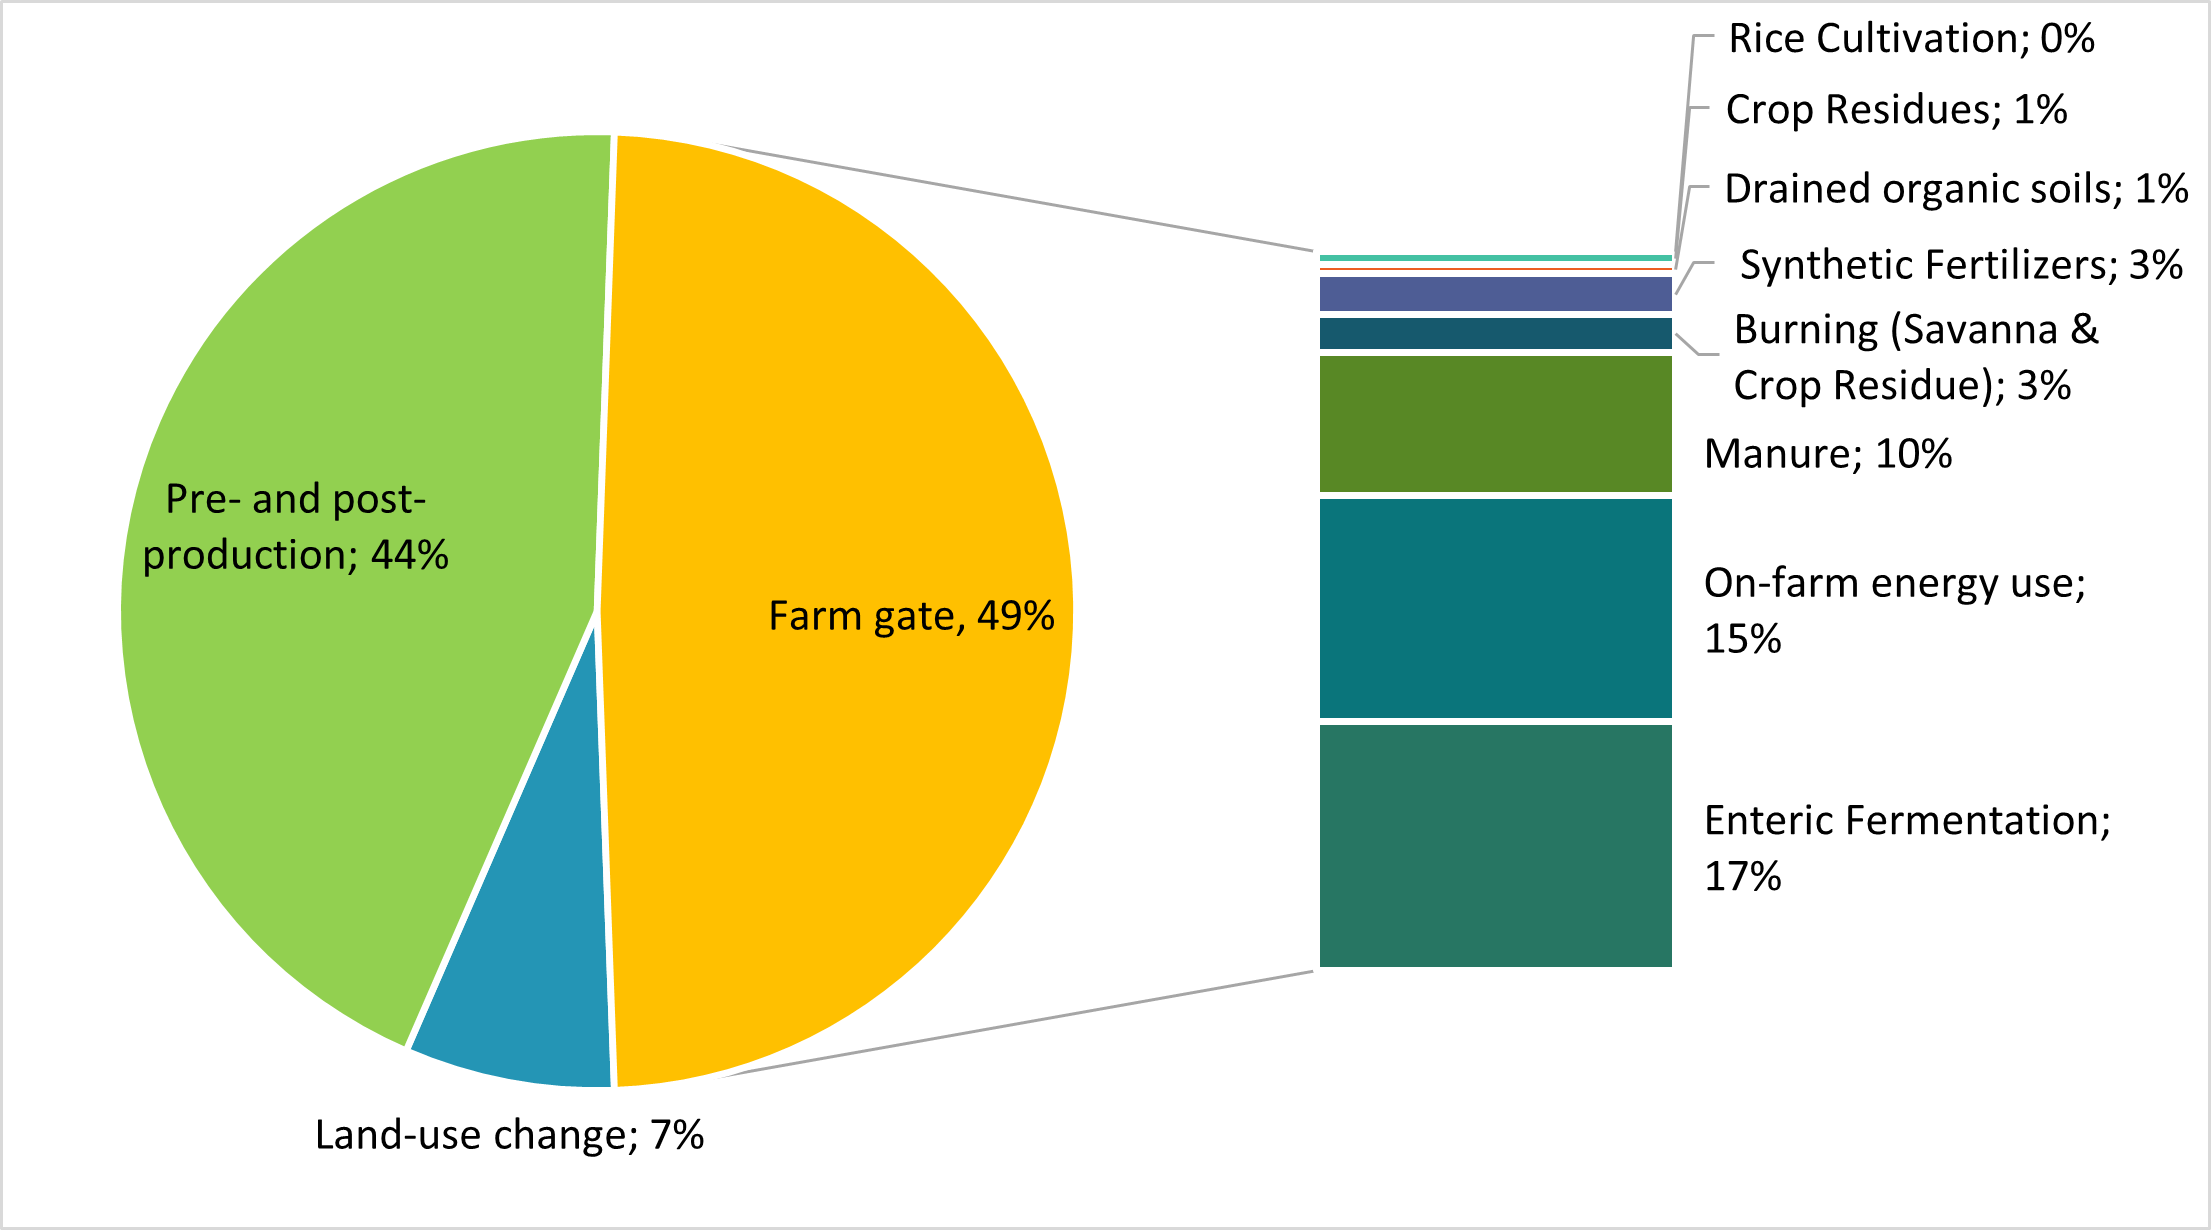
Figure 3: GHG Emission Sources from South African Agrifood systems (10-year avg. 2013-2022)
Source: FAO, 2024
In Summary South Africa’s agricultural sector plays a significant role in the country’s greenhouse gas (GHG) emissions, though its contribution remains below the global average. Methane and nitrous oxide—primarily from livestock and soil management—are the dominant sources of on-farm agricultural emissions, while carbon dioxide plays a relatively minor role. When comparing agricultural GHG emissions per GDP and per capita, South Africa ranks moderately among the top global emitters, reflecting both its economic structure and population size.
The data from EDGAR and FAO highlight the complexity of measuring and interpreting agricultural emissions, especially when considering factors like land-use change and energy consumption beyond the farm gate. These insights highlight the importance of targeted mitigation strategies, improved data accuracy, and sector-specific interventions to reduce emissions while maintaining agricultural productivity and food security.
[1] EDGAR data is lagged by one year, hence 2024 data is not yet available
[2] Power Industry (Power and heat generation plants (public & auto producers))
Fuel Exploitation (Production, transformation and refining of fuels)
Industrial Combustion (Combustion for industrial manufacturing)
Transport (Mobile combustion (road & rail & ship & aviation))
Agriculture includes agricultural soils, crop residues burning, enteric fermentation, manure management, indirect N2O emissions from agriculture
Industrial processes (e.g. emissions from the production of cement, iron and steel, aluminum, chemicals, solvents, etc.)
Waste refers to the solid waste disposal and wastewater treatment
Buildings (Small scale non-industrial stationary combustion)
[3] Power industry, fuel exploitation, industrial combustion, transport, agriculture, industrial processes, waste and buildings
[4] Further difference between data sources may be due to a difference in calculation, FAO uses Tier 1 methods, while EDGAR uses Tier1 and Tier 2 methods.